The $46 Employee vs The $3 Robot: A Dual-Scenario P&L Business Case 2026 Reality vs 2031 Maturity
Hard-hitting exploration comparing the full cost of human labour against humanoid robot and AI agent labour for a representative $5 million small enterprise company. The question none of the industry forecasts is asking: What happens to the economy those robots are supposed to serve?
Colleen McCann EMBA, CMS, PMP
Prepared as an exploratory analysis. Co-authored by Claude Fable 5. Written for a general audience. All figures in US dollars unless noted.
Executive Summary
The following is a hard-hitting exploration comparing the full cost of human labour against humanoid robot and AI agent labour for a representative $5 million small enterprise company.
The presentation shows two scenarios highlighting trajectory: 2026 prices and capability, and 2031 prices and capability when fleet learning, mass production and five more years of wage growth have moved every number. It then asks the question none of the industry forecasts ask: What happens to the economy those robots are supposed to serve?
The Grand Canyon Cost Gap That Widens Every Year
- Fully loaded North American worker costs $46/hr compounding at about 3.4% per year
- Humanoid robots deliver labour at roughly $11–$15/hr, trending toward $3. Works two shifts, has no payroll taxes, no benefits and favourable tax code treatment
- Standing still is not neutral – wage growth erodes profit margins in an identical company
The Robots Are Winning Even When They Half Fail
- Even at 50% of human effectiveness an automated company today still out-earns its all human equal
- At 2031 task parity, the investment returns over 300% annually after tax, paying back in about three months
- Rented robot labour at about $18/hr undercuts the cheapest decile of human workers with zero capital at risk
- The business case does not depend on the technology being perfect or the tax breaks surviving
There’s No Escape Hatch And Every Forecast Ignores The Impact On Demand
- Every previous transition displaced one kind of work and pushed workers into another
- AI is taking the cognitive ladder, while humanoids take the physical ladder simultaneously
- The industry's reassuring net-new-jobs math quietly assumes displaced workers keep spending like employed ones, and not one major forecast models what happens when they can't
The Bottom Line For Organizations
The economics are already settled, the future of business will see much less human faces, and it will lead to a seismic shift in economic and legislative policy.
- Rent now to capture savings on someone else's depreciating asset
- Buy in financed tranches as capability proves out
- Front-load deductions while the tax window is open
- Build business cases on labour savings, not tax perks, so they’ll survive the policy backlash that mass displacement will provoke
The companies treating this as a five-year execution problem rather than a ten-year debate will be the ones writing P&Ls everyone else studies.
The Bottom Line For Workers
The math is not on your side and pretending otherwise is dangerous. Machine labour costs a tenth of what you do, gets cheaper every year and is being deployed in both physical and cognitive work. No previous generation of workers has EVER faced labour and technological conditions like this before.
- The machines stop at judgment under ambiguity, accountability, trust, fine dexterity, directing, auditing and improving the machines themselves. Be part of the human core that earns more because everything now depends on it
- The window is 5–8 years, use it to move from performing routine work to orchestrating it. You cannot out-compete a $3/hr machine. You can own the systems, hold the judgment and be the person the machines answer to
- Workers who treat this as a career redesign deadline rather than a debate about whether it's really happening, will be the ones the P&Ls still have a line item for
This is the individual answer. The collective one — what happens to those who can't make that move — that’s the political question nobody has answers for, but everyone needs to start talking about.
Why Humanoids Are Being Built
Shifting demographics represent a labor gap that traditional automation alone cannot solve. Acute examples are China, Japan, South Korea, Germany and Italy. Goldman Sachs explicitly identifies the shortage of skilled workers as a key market driver and sees the technology as a structural response.
Why humanoid specifically, instead of more specialized robots? The main advantage is that they’re general purpose, able to move around an existing facility doing various jobs as opposed to traditional robots which have more limited capabilities and often require a factory to be reconfigured. Unlike fixed industrial arms, humanoid robots can operate within and interact directly with existing infrastructure designed for people. The world is already built to our human dimensions — stairs, door handles, tools, workstations — so a human form machine can literally step into any environment without changing anything and that represents significant cost savings.
Why Is This Possible Now?

AI Capability Leaps
LLM’s and vision-language-action models gave robots the ability to understand context, follow natural language instructions and learn tasks from a handful of demonstrations
Meaning no specialized programming or technical skill is required

Hardware Cost Reductions
Bringing a capable humanoid from a $1M+ price tag to under $100K today
2031 projections are estimating the $10,000 - $30,000 range as production capacity comes online and continuing technology and design bring further price reductions

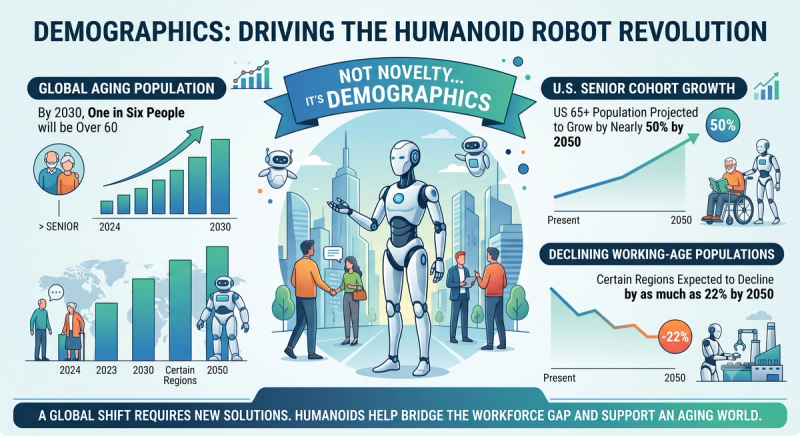
Demographic Shift
Ageing populations create a labor shortage situation where todays highly specialized traditional automation alone can’t step in and fill the gap
The shift is from programmed automation to general purpose embodied intelligence — machines that can reason about the physical world and adapt to its unpredictability
Despite the hype, deployment today is deliberately narrow focusing on well-defined tasks such as material handling, simple assembly and logistics. Tesla is converting its Fremont factory to Optimus production and the units in operating there and in the Texas Gigafactory are serving as data set generators for larger public deployments expected in 2027. Figure is running its first home pilots and expanding factory deployments beyond BMW Spartanburg, and Boston Dynamics has begun limited Atlas shipments.
- Manufacturing/logistics — warehouse picking, packing, machine tending, line feeding
- Elder and healthcare — driven hardest by Japan where 29% of the population is over 65, humanoid robots are seen as essential for elder care given the severe caregiver shortage
- Dangerous inspection and heavy industry — bridges, tunnels, power plants and startups building humanoids for welding, grinding and shipyard work where human access carries risk
- Home/consumer — the new frontier led by 1X's NEO and Tesla's consumer Optimus, these is the least mature applications
The long-term vision is scale on the order of the automotive sector
At projected operating costs of just $2-3 per hour the OEM-level market alone could reach $750 billion by 2035 in an optimistic scenario, scaling to $2–4 trillion by 2050
Morgan Stanley goes further: by 2050 the US alone may have 63 million working humanoid robots, potentially affecting 75% of occupations, 40% of employees and roughly $3 trillion in payroll
The most aggressive forecasts assume over 3 billion humanoids integrated into society by 2060
The Two Camps: What Each Argues
The labour-economics debate splits into two positions and both are summarised below with the evidence each actually cites.
| Optimist- The Augmentation Case | Critic – The Displacement Case |
|---|---|
Core claim: robots take tasks not jobs, and fill roles humans won't or can't | Core claim: this automation wave is structurally different and the reassuring "net |
• No documented layoffs yet: As of mid-2026 there are reportedly no layoffs anywhere directly attributed to humanoid robots. The robots in service are walking into jobs nobody wants and nobody can fill • The vacancies are real and large: ~500,000 unfilled US warehouse/logistics roles in early 2026; manufacturing turnover ~39%/yr; fulfilment centre turnover >150%; a projected ~8M-position global structural shortfall by 2030 (Manufacturing Institute) • Substitution is task-level, not job-level: Replacement happens at the task level — repetitive, physically demanding, unattractive functions — which changes how automation maps to employment. At GXO, workers stationed alongside Digit were moved into supervisory and coordination roles, not let go • Net job creation, historically and forward: WEF's Future of Jobs Report (2025): 85–92M jobs displaced but 97–170M created by 2030. A net gain in fleet management, AI training, and maintenance. A McKinsey consultant expects up to 5M humanoids by 2040 without a substantial net cut to the human manufacturing workforce • Cost/reliability limits slow displacement: A Science Robotics debate (May 2026) notes full lifecycle cost — power, maintenance, re-tasking — can exceed human wages especially in low-wage economies, structurally slowing replacement where workers are cheapest | • Dual displacement removes the escape hatch: Stanford's Erik Brynjolfsson says the coming displacement is potentially 10–100x more disruptive than the 1990s auto-industry hollow out, because AI is taking cognitive work while humanoids take physical work simultaneously, leaving no "up-the-ladder" destination sector • Speed without a reallocation buffer: Previous transitions played out over generations, giving displaced workers time to move. A November 2025 study found a ~16% decline in certain entry-level positions since ChatGPT's release; the IMF estimates AI could significantly affect ~40% of jobs worldwide • Gains accrue to capital, not labour: US Bank notes the gains from technology have reliably accrued to capital with no structural reason to expect humanoids to reverse it. Income concentration already exceeds its pre-pandemic peak and sits at a 60-year high before meaningful humanoid deployment • Wage suppression even without replacement: Employers could use the credible threat of robot replacement to suppress wage demands for workers who do keep their jobs. Oxford Economics estimates robot adoption could widen the top 10%/bottom 50% wage gap by 5–12% over the decade absent policy intervention • The net positive masks the distribution: An event that destroys 92M |
The zero layoffs / net job creation argument describes a period when almost no humanoids are doing paid work. ~200 units are productively deployed worldwide in mid-2026 and one cannot infer labour impact from the phase before it’s deployed at scale. Augmentation is what you would observe regardless of the eventual outcome
Capital-vs-labour distribution is a 60-year observed trend, not a forecast Timing, costs, battery life, dexterity and autonomy limits are real and push the aggressive scenarios further out than the rhetoric implies
Near-term, augmentation is likely correct because deployment is slow and targets unfilled roles while building the foundational dataset required for mass adoption. The displacement risk is real but back-loaded and the distributional problem is nearly certain regardless of the net-jobs number
The P&L Scenarios - Assumptions Common To Both
The question tested: For a mid-size organization, how does the P&L picture change if human workers are replaced by autonomous ones — humanoid robots for physical work, AI agents for office work — today versus five years from now, and what does the tax system contribute?
The following factors are assumed:
- US federal tax rules - 21% corporate rate; 100% bonus depreciation, permanent under the 2025 OBBBA; Section 179 limit $2.56M in 2026
- Canadian rules differ, however the direction of the argument holds in both countries, but Canadian specifics were not sourced for this analysis
- Revenue and all non-labour cost lines are held constant at 2026 levels in both scenarios, deliberately, to isolate the labour effect. In reality inflation lifts revenue and materials too; holding them flat makes the comparison clean rather than realistic
- A human working year is 2,080 hours. A robot delivers ≈ 4,000 productive hours/year (two shifts net of charging and maintenance)
- Company figures are illustrative; wage, tax, and robot-price figures are sourced
This model's assumptions of static revenue, 3.4% wage growth and fixed demand are defensible through roughly 2031 because displacement is supply throttled. Beyond this horizon they would fail. This example is not meant to be extrapolated past its window.
Where The Assumptions Differ
| Assumption | Scenario A — 2026 | Scenario B — 2031 |
|---|---|---|
Robot capability (structured tasks) | 30–70% of human throughput | ≈ human parity |
Humanoid hardware, avg. all-in unit | $45,000 | $18,000 |
Hardware price trend | - | −20%/yr (half the reported −40%/yr, for conservatism) |
RaaS pricing trend | $2,000–$5,000/mo ≈$30/hr | −10%/yr (half the hardware rate) → ≈$1,200–$3,000/mo ≈$18/hr |
Loaded labour cost trend | 2026 BLS actuals | +3.4%/yr (BLS Employment Cost Index) → ×1.18 |
Integration & validation overhead | 30% of hardware | 25% (standards matured) |
AI agent costs | Sourced market ranges | Assumption only — no market projection exists |
On the RaaS assumption: rental rates should fall more slowly than hardware because vendors carry idle-asset and obsolescence risk and price it into the rate, partially offset by vendor competition and cheaper fleet replacement. Half the hardware decline rate is a reasoned assumption not a measured trend. The RaaS market is too young to have one. In the long-run RaaS should converge toward hardware cost plus financing and service margin, so the half-rate assumption is conservative for the medium term.
Why 2031 Task Parity Is A Defensible Case
Front loading humanoid fleet learning (Tesla Optimus Freemont & Texas Gigafactory). Unlike earlier AI, which fed on the internet’s free text and images, there is no ready humanoid how-to-manipulate data bank. Instead, every deployed unit is a data collector for the future units coming off the line. Skills learned by one unit transfer to every identical unit instantly. Todays teleoperated and simulated hours are front loading a compounding skills library; deployment scaling generates the training data deployment needs. For structured, repeated tasks like tote handling, machine tending, kitting, routine assembly, in addition to routine clerical work for AI agents — human level throughput by roughly 2031 is a reasonable estimate for a combined humanoid/AI stack.
The limitations:
- Transfer is clean across identical hardware but not across contexts — a policy learned in one facility needs site adaptation for different layouts, lighting, and object variants. Proficient after brief tuning not plug-and-play
- Fleet data is skewed toward what fleets already do; frontier skills still need deliberate, expensive data collection
- Human-parity fine dexterity (deformable objects, force-sensitive assembly, tactile-dense work) is a hardware problem — sensor density, durability, cost — on a slower iteration cycle than software
What a Human Worker Costs: 2026 & The 2031 Trajectory
An employer’s real cost is wage plus benefits plus legally required payroll costs (Social Security, Medicare, unemployment insurance, workers’ compensation). US Bureau of Labor Statistics, March 2026, with a 2031 projection at the measured 3.4% annual compensation growth:
| Segment (US private industry) | Wage/hr 2026 | Benefits/hr | Total/hr 2026 | Total/hr 2031 (proj.) |
|---|---|---|---|---|
All workers (average) | $32.60 | $14.01 | $46.60 | ≈ $55 |
Manufacturing (all employees) | ≈ $31 | ≈ $15 | $46.30 | ≈ $55 |
Production / warehouse | $30.10 | ≈ $12 | ≈ $42 | ≈ $50 |
Median worker (50th %) | — | — | $34.78 | ≈ $41 |
Lower wage (10th %) | $14.88 | $3.18 | $18.06 | ≈ $21 |
Higher wage (90th %) | — | — | $89.70 | ≈ $106 |
Benefits and mandatory payroll costs add roughly 30% on top of every wage dollar — a surcharge that exists only for human labour. Canadian wage levels are broadly comparable with a similar load (CPP, EI, provincial levies, workers’ compensation).
Model company loaded annual cost tiers under both scenarios:
| Role tier | Loaded cost/yr — 2026 | Loaded cost/yr — 2031 |
|---|---|---|
Production / warehouse | $62,000 | $73,000 |
Office / administrative | $84,000 | $99,000 |
Skilled / supervisory | $110,000 | $130,000 |
Management | $160,000 | $189,000 |
What Humanoid Labour Costs: 2026 & The 2031 Trajectory
2026 is the first year of real (but limited) purchase orders — roughly 16,000 units installed globally in 2025. Forecasts show 50,000 shipments for 2026. Representative pricing today, with the conservative −20%/yr projection applied:
| Platform / model | 2026 price | 2031 (proj.) | Notes |
|---|---|---|---|
Unitree G1 | $16,000 | ≈ $5,000 | Shipping today |
Tesla Optimus Gen 3 | $20,000–$30,000 target | ≈ $7,000–$10,000 | Tesla factories first |
Apollo / Agility Digit | $50,000–$250,000 | ≈ $16,000–$82,000 | Mostly rented |
Figure 03 | ≈ $130,000 (est.) | ≈ $43,000 | Enterprise only |
Industrial RaaS rental | $2,000–$5,000/mo (≈$30/hr) | ≈ $1,200–$3,000/mo (≈$18/hr) | −10%/yr assumed |
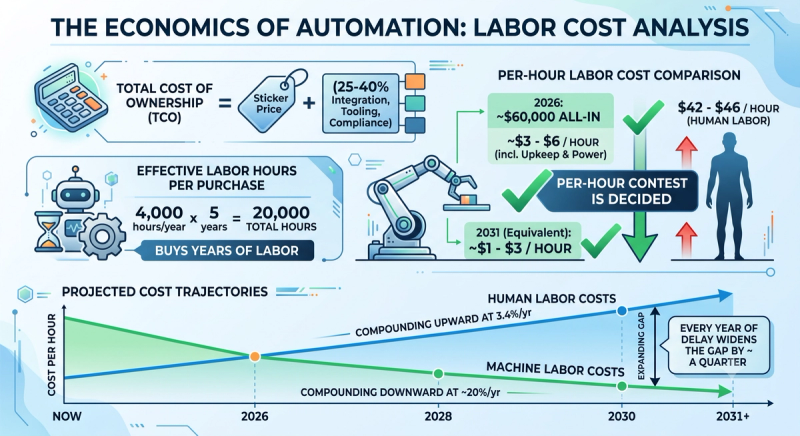
- One robot purchase = 5 years of service
- Human labour costs always trend upwards, while machine costs generally trend downwards
- Even with added costs of maintenance and integration automation still holds the advantage
In every conceivable metric the outcome is clear, automated workers cost corporations vastly less than human labour.
The Example Company
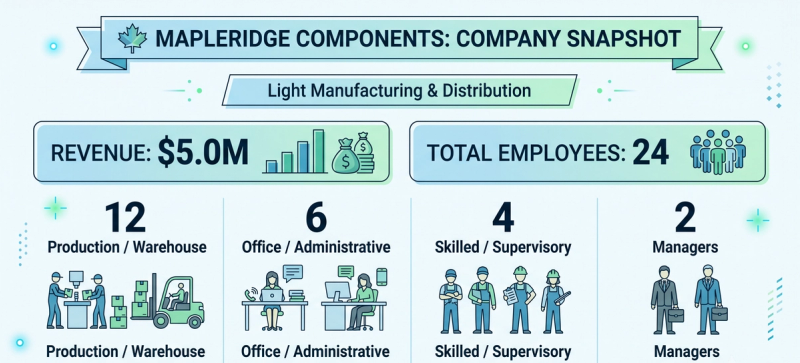
- 2026 loaded labour: $2,008,000 (40% of revenue)
- 2031 loaded labour for the identical headcount: $2,368,000 (47% of revenue) increases come purely through wage growth
In both scenarios, automation replaces the same 14 roles:
10 production/warehouse jobs go to 10 humanoid robots, 4 administrative jobs go to AI agents — keeping 10 humans: 2 production, 2 administrators, 4 skilled (one retrained as robot technician), 2 managers
The Investment
| One-time capital purchase | 2026 | 2031 |
|---|---|---|
10 humanoid robots | $450,000 | $180,000 |
Integration, validation, compliance, training | $135,000 | $45,000 |
AI agent platform implementation | $75,000 | $35,000 |
Total Capitalized Investment | $660,000 | $260,000 |
New Recurring Machine Costs
| Annual machine operating costs | 2026 | 2031 |
|---|---|---|
Maintenance & spare parts (≈10% of hardware) | $45,000 | $18,000 |
Robot fleet-management software | $18,000 | $15,000 |
**AI agent platform & consumption | $45,000 | $35,000 |
Electricity (charging) | $12,000 | $12,000 |
Incremental insurance | $10,000 | $8,000 |
Total machine operating cost / year | $130,000 | $88,000 |
**Replacing four administrative roles means roughly three to four multi-agent workflows (accounts payable/receivable, order processing, scheduling, customer correspondence).
2026 market data: agency-built multi-agent workflows run $5,000–$25,000 to build plus $1,000–$3,000 per month each to operate. Enterprise-platform implementations are publicly reported at $50,000–$150,000 with ongoing consulting of $10,000–$25,000/month at the high end. Consumption-based pricing (per conversation or per credit) is the documented budget risk. Analyses of deployed platforms find the subscription becomes the smallest cost line by year three, behind integration, inference, and maintenance. The model uses $75,000 implementation and $45,000/year running cost — mid-range for the agency path, well below the enterprise-platform path.
The 2031 AI figures ($35,000 / $35,000) are assumptions — no source projects agent pricing that far out. Underlying model inference costs are falling steeply, which argues down; but vendor pricing is shifting to consumption models where spend scales with usage, and implementation remains human consulting labour, which rises with wages. Capability per dollar will almost certainly improve; total spend for this scope is unfortunately uncertain in both directions.
The P&L Comparison
Robots are depreciated over five years using accounting depreciation, but under bonus depreciation the full purchase is deducted in year against tax owed. The tax actually paid line shows the cash effect. Revenue and non-labour costs are held constant across all four columns to isolate the labour decision.
The reality of 2026 humanoid and AI Agent effectiveness ranges from 30%-70%, for example purposes we’ll assume 50% effectiveness rate compared to human workers. This means 7 of the 14 roles originally eliminated have to be “hired back” at the same rate. By 2031 task parity will bring a 100% effectiveness rate of humanoids and AI compared with human workers, so the full 14 roles will be eliminated.
| P&L line (year 1) | 2026 Human | 2031 Human | 2026 Automated (50% effectiveness assumed) | 2031 Automated (Task parity applies) |
|---|---|---|---|---|
Revenue | $5,000,000 | $5,000,000 | $5,000,000 | $5,000,000 |
Materials & other direct costs | (1,700,000) | (1,700,000) | (1,700,000) | (1,700,000) |
Direct labour — human | (744,000) | (876,000) | (434,000) | (146,000) |
Gross Profit | 2,556,000 | 2,424,000 | 2,866,000 | 3,154,000 |
Indirect labour — human | (1,264,000) | (1,492,000) | (1,096,000) | (1,096,000) |
Machine operating costs | — | — | (130,000) | (88,000) |
Facilities & other overhead | (620,000) | (620,000) | (620,000) | (620,000) |
Depreciation (book) | (120,000) | (120,000) | (252,000) | (172,000) |
Operating profit (EBIT) | 552,000 | 192,000 | 768,000 | 1,178,000 |
Tax actually paid (yr 1)* | (115,920) | (40,320) | (50,400) | (203,700) |
Profit After Cash Taxes | 436,080 | 151,680 | 717,600 | 974,300 |
Human labour as % of revenue | 40% | 47% | 31% | 25% |
Payback on robot capex | — | — | ≈ 23 months | ≈ 3 months |
*Tax math: taxable income = EBIT with book robot depreciation added back and the full purchase deducted instead. 2026: $718,000 taxable × 21% = $150,780 (the bonus shield absorbed $111,000 of tax). 2031: $970,000 taxable × 21% = $203,700 (shield absorbed $44,000). Note the shield shrinks as hardware gets cheaper — the tax perk matters less over time even before any policy change.
*Tax math, half-effectiveness column: taxable = $768,000 EBIT + $132,000 book depreciation − $660,000 bonus deduction = $240,000 × 21% = $50,400
Analysis
- Doing Nothing Costs Companies: same company, same 24 people, same revenue: after-tax profit falls from $436,000 to $152,000 in five years purely because compensation grows by 3.4% a year - standing still is not a neutral choice
- The Savings Gap Increases: $216,000 savings now versus $986,000 in 5 years - wages up, hardware down: both curves move against the human-labour model
- Capital Intensity Drops: The $260,000 2031 entry ticket is 39% of the 2026 one, dropping ROI from 10 months to 3 months, and RaaS at ≈$18/hr undercuts even the 10th-percentile human ($21/hr, 2031) — meaning by 2031 the rental route alone beats the cheapest human labour, with zero capital at risk
- Even At 50% Effectiveness Humanoid/AI Labour Fleet Still Wins: The ROI is on par with ordinary capital project performance. The #1 risk today is still capability, but as capabilities improve year-over-year the savings gap widens in favour of automation
- 5 Year Cumulative Pre-Tax Benefit: ≈ $1.1M for a 2026 deployment; ≈ $5.0M for a 2031 deployment (higher wages saved, lower capex, full capability). Deploying earlier captures fewer dollars per year but more total years
- These Figures Are A First-Mover Snapshot: The gap assumes competitors remain on human labour, or do not have as many humanoids, for the full five-year window. RaaS and fleet learning mean adoption barriers are low, so this advantage decays as competitors adopt and cost savings compete away into prices. The gap represents an edge with a half-life, not a perpetuity
How Robust Is The Business Case?
The P&L compared two representative scenarios using a defined set of assumptions, which are useful for a clean example but not entirely realistic. Robot capability, utilization, hardware pricing and labour costs will vary across industries and over the 5 year timeframe examined here. Using sensitivity analysis tests whether the business case remains attractive under a broad range of plausible conditions. This shifts the question to: how wrong can the assumptions be before the business case no longer works?
The largest uncertainty today is capability. Current humanoids remain limited to structured environments and repetitive workflows, but we know this is evolving. Rather than assuming a single effectiveness value the business case can be stress-tested across the full range.
| Robot Effectiveness | Roles Replaced | Improvement vs Human Baseline | Approx. Payback |
|---|---|---|---|
30% | 4 | +$140,000 | 40 months |
40% | 6 | +$210,000 | 30 months |
50% (Current Model) | 7 | +$281,500 | 23 months |
60% | 8 | +$354,000 | 17 months |
70% | 10 | +$424,000 | 13 months |
80% | 11 | +$494,000 | 9 months |
100% (at task parity) | 14 | +$659,000 | 10 months |
Improvement = year 1 after-tax profit vs the 2026 all-human baseline; 2026 wages and $660K capex throughout
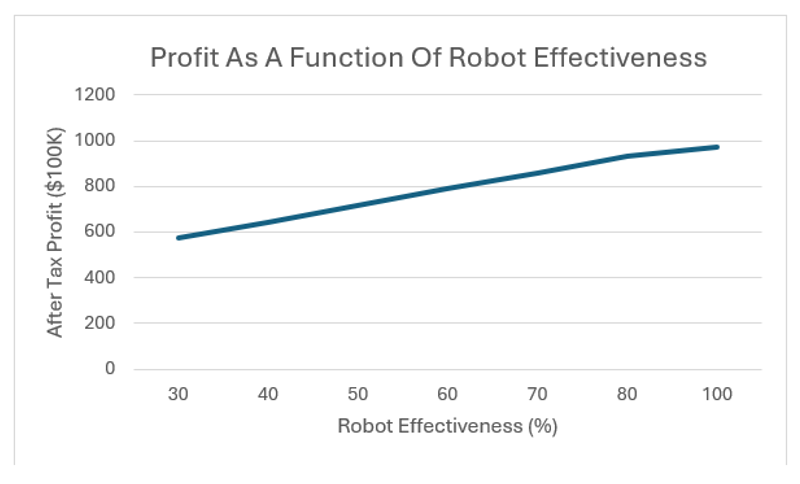
The investment does not require human-level robot performance. Even at approximately 40–50%, the automated scenario outperforms the all-human baseline. Every incremental improvement in robot capability further widens the profit gap while shortening the investment payback period.
Utilization is a key variable as well, humanoids only generate value while performing productive work. A robot working only one shift has fundamentally different economics than one operating two shifts. It is therefore possible for one robot to replace 2 opposite shifted human workers, further compounding gains.
As a note: the P&L case deliberately monetized a 1:1 replacement for simplicity, but this means the headline numbers do understate the case for multi-shift operations.
| Productive Hours / Year | Relative Labour Cost | Business Case |
|---|---|---|
2,000 | Highest | Weak |
2,500 | Moderate | Acceptable |
3,000 | Competitive | Good |
3,500 | Strong | Excellent |
4,000 (Model assumption) | Lowest | Outstanding |
Organizations with multiple shifts, highly repetitive workflows, continuous production and warehouse operations will realize stronger returns than facilities operating a single daytime shift. Adoption should focus on environments capable of maximizing productive operating hours rather than focusing on the number of robots deployed.
The P&L assumed fixed annual compensation growth consistent with recent BLS Employment Cost Index data. However, labour inflation continues to remain uncertain. Rising labour costs will widen the economic advantage of automation, while factors suppressing wage growth slows it materially. Automation remains attractive in all cases, but the investment payback is where the change is noticeable.
| Annual Labour Inflation | 2031 Loaded Human Cost | Relative Automation Advantage |
|---|---|---|
2% | Lower | Moderate |
3.4% (Model assumption) | Baseline | Strong |
5% | Higher | Very Strong |
6% | Highest | Exceptional |
The success of any humanoid deployment is determined primarily by operational execution, not electricity prices, maintenance costs or financing. The three variables organizations can most influence are:
- Select appropriate tasks
- Maximize utilization
- Ensure sufficient operational maturity before scaling deployments
| Variable | Relative Impact |
|---|---|
Robot capability | ★★★★★ |
Robot utilization | ★★★★★ |
Human labour inflation | ★★★★☆ |
Hardware purchase price | ★★★★☆ |
Integration costs | ★★★☆☆ |
Maintenance costs | ★★☆☆☆ |
Electricity | ★☆☆☆☆ |
Insurance | ★☆☆☆☆ |
Analysis suggests the investment thesis does not depend upon a single optimistic assumption. Instead, the business case proves resilient across a wide range of plausible outcomes. The underlying economic direction remains consistent:
- Rising labour costs fully support automation economics even at reduced capability
- Lower hardware costs accelerate investment returns
- Higher utilization dramatically increases value creation
- Improvements in robot capability shorten payback without fundamentally changing the long-term conclusion
The principal risk facing organizations may not be adopting automation too early, but failing to build operational capability required to deploy it effectively while the technology matures
Tax Treatment: What The Machine Advantage Really Is
Capital equipment purchases enjoy tax breaks in the form of depreciation and bonus depreciation. Human labour wages, benefits and payroll taxes are fully deductible business expenses. For example, Mapleridge’s 2026 payroll reduced its tax bill by roughly $422,000. Humanoid/AI’s advantage is real but different:
- No Payroll Surcharge: On top of a US wage the employer pays 7.65% Social Security/Medicare, unemployment insurance, workers’ compensation, and typically health, retirement, and paid leave — roughly +30% on every wage dollar. A robot has none of that
- One Payment = Years Of Labour: A worker is paid annually for that year’s labour but a robot is paid for once and works approximately five years
- Upfront Deduction: Under the OBBBA (2025), 100% bonus depreciation is permanent for equipment placed in service after January 19, 2025; separately, Section 179 allows expensing up to $2.56M (2026) with a $4.09M phase-out. The entire robot fleet purchase is deducted in year one against income the machines will earn for years. A worker’s wage deduction can never be pulled forward like this. Accelerated deductions are essentially an interest-free loan from the government
- Deduction Can Be Financed: Buy the fleet on a five-year loan, deduct 100% now and pay ≈20% of the cash this year. Year 1 tax savings can exceed the year-one loan payments — the government effectively funds the down payment on the machines
The tax shield shrinks as hardware cheapens and the economics increasingly stand on labour savings alone, which is a hedge against tax policy changes that will come as payrolled labour forces shrink.
Canadian readers: the same logic runs through CCA and accelerated-investment rules, but classes, rates, and current-year limits differ. Always verify the 2026 Canadian treatment of humanoid robots with a tax professional.
The Most Cost-Efficient Replacement Path
How an organization could leverage tax deferrals and depreciation while replacing workers across as many roles as possible, explored as a sequence:
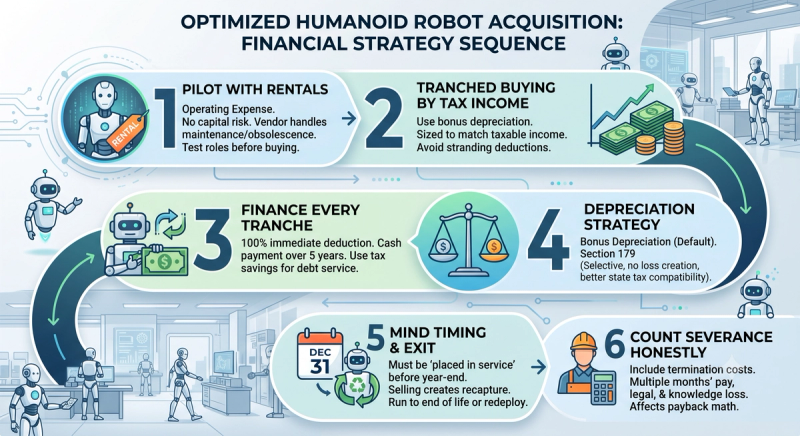
As the P&L case illustrated, falling hardware prices reward waiting while rising wages and an eroding baseline punish it. The offset is:rent now to capture savings immediately on someone else’s depreciating asset, buy later when hardware is cheap and capability is more mature. The RaaS-first path is not just smart risk management it’s the mathematically efficient way to ride both curves.
Countering The Tax-Policy-Reversal Risk
Income and payroll taxes fund Social Security, Medicare and unemployment insurance (CPP and EI in Canada).
When enough companies begin to convert payroll into depreciated capital at scale (via the combination of AI & humanoid robotics) governments will realize painful loses precisely as displaced-worker costs rise. The predictable response is going to be robot taxes – per unit automation levies, depreciation carve-outs for labour displacing equipment or payroll-tax rebalancing. These have already been proposed; Sam Altman, Vinod Khosla and Bill Gates have all publicly advocated for a robot tax. South Korea trimmed automation tax credits as early as 2017, and the European Parliament debated a levy in 2017. The idea resurfaces regularly and will become a reality as mass scale worker displacement becomes more widespread.
Across a 5–7 year deployment horizon this risk grows because legislators have time to react to visible displacement. An organization building its model with current tax treatment should assume the treatment changes and plan for it.

Get it while the gettin’s good!
Retroactive tax changes on already-claimed deductions are rare, therefore deductions captured under current law are effectively locked in. Front load capital purchases, every tranche expensed under 100% bonus depreciation now is a shield the change cannot claw back. This means balancing accelerated purchases of proven capability, rather than waiting for the hardware price decline

Stress-test the case with the perks removed
Re-run the numbers using plain five-year straight-line depreciation and no bonus. Mapleridge’s 2031 automated scenario still earns ≈ $980,000 after tax vs. $152,000 for the human baseline. The deduction timing moves cash between years but the case is built on labour savings, not tax arbitrage. If an automation project only clears the hurdle because of bonus depreciation it’s a tax play that no longer has legs. Fund only projects that survive the stress test

Model a robot tax scenario explicitly
Any robot tax design will likely mirror employer payroll taxes from the displaced wages. For example, ≈7.65% of $62,000 – $73,000, equalling about $5,000–$5,600 per robot per year.
For Mapleridge: 10 robots × $5,500 = $55,000/yr. Against annual labour savings of $1.0–1.1M the case absorbs it with margin to spare. Estimating the break-even robot tax level converts a vague political fear into a bounded, monitorable number. In the Mapleridge example roughly $100,000 per robot per year, which would be far beyond any serious legislation

Keep a rented tranche permanently
RaaS costs are considered ordinary deductible operating expenses, any robot tax aimed at asset owners’ lands first on the vendors. Holding a percentage of machine capacity (say 25-30%) as rental acts a structural hedge. If purchasing perks are repealed or the robot tax arrives, capacity can shift toward rental without operational disruption

Watch jurisdiction conformity and keep options open
State (and provincial) tax systems diverge, some states never adopted federal bonus depreciation. Multi-site organizations can weight deployments toward jurisdictions with stable treatment. Organizations should avoid capital structures that only work in one jurisdiction’s regime

Shape the displacement story before regulators do
tax proposals consistently target “job-destroying” automation, therefore an organization that retrains and redeploys part of its workforce documents safety and quality gains and grows output rather than only cutting heads presents a materially smaller political and reputational target. In fact, some draft levy designs explicitly exempt automation paired with retraining. Attrition-paced replacement achieves the same headcount end-state with no layoff event to legislate against

Monitor leading indicators
Bills carving labour-displacing automation out of section 168(k)/§179, NOL-usage tightening, EU or state-level robot-levy pilots, social-insurance funding reviews that name automation
Assign the watch to whoever owns tax planning and pre-agree the trigger at which the organization shifts from buy to rent
The critical point is to make the tax treatment a bonus, not a foundation. The durable technology advantages: no payroll surcharge, one payment for years of labour and the widening wage-vs-hardware cost gap, survive any plausible depreciation reform. An organization positioned on these, leveraging front loaded deductions and a rental hedge in place, is minimally exposed to policy reversal.
An estimated break even analysis suggests:
- The investment case remains resilient even if robot productivity falls below expectations
- Purchase prices could remain above projected levels while preserving attractive economics
- Any proposed robot taxes would need to reach levels far beyond any currently discussed policy proposals before materially altering investment decisions.
- The economics are considerably more sensitive to robot capability and utilization than to hardware pricing alone
| Variable | Estimated Break-even |
|---|---|
Robot productivity | ≈40% of human output |
Robot utilization | ≈2,500 productive hours/year |
Average purchase price | ≈$80,000 per unit |
Annual robot tax | ≈$100,000 per robot |
Labour inflation | Near zero sustained growth |
Augmentation Vs Displacement: The Demand Problem No One Is Modelling
Does the economy that's supposed to buy the robots’ output survive the replacement?
The labor-shortage-not-job-displacement narrative is somewhat self-serving on the part of industry. It consistently frames humanoids, and AI, as filling gaps rather than displacing workers. This is very convenient messaging yet the counterargument is real.
This is the first time automation is tackling both physical and cognitive work at once. ALL previous transitions played out over generations giving displaced workers time to adjust. Whether humanoids fill a gap or displace labor depends entirely on deployment speed and which sectors move first. Nobody can yet make solid predictions, but the consequences of the next few years are seismic. Is the convergence of humanoids and AI going to result in an economic death spiral? Three counterweights emerge acting as release valves.
The UBI Economy
UBI is already in mainstream policy conversation for exactly this reason but a critical asymmetry is being ignored. Wage income compounds — through career progression, productivity and bargaining — while a UBI is likely to be a set political number that erodes to inflation. A UBI-supported economy is demand-stabilised but not demand-growing. It puts a floor under consumption but a capitalism running on flat, politically administered demand is a structurally different lower-growth economy than one running on compounding wage income. The question is not whether the spiral is possible it’s whether the political system installs the floor before the spiral runs.
The Catch-22
Every individual firm benefits from replacing its own workers — higher revenues, lower costs because everyone else's workers are still buying. But if all firms do it aggregate demand collapses and every firm's revenue falls. Each firm's individually rational move is collectively suicidal. Markets are structurally bad at solving this without external coordination — regulation, taxation, redistribution — precisely because no single firm can afford to unilaterally retain expensive labour as charity. The demand collapse is not prevented by capitalists being smart, it can only be prevented by something outside the firm.
Global Demand Is Not Monolithic
Displacement will hit sectors and geographies at different rates, so demand can hold in some regions and segments while collapsing in others pushing the effect across time rather than producing a single cliff. This buys time and theoretically makes spiral overstate the smoothness of the result. The likelier shape is a series of regional and sectoral demand contractions that policy responds to, or fails to, unevenly. It changes the texture, not the direction.
Question The Net New Jobs – Is 170M Realistic?
If a loaded human worker costs tens of dollars per hour and a robot cost as little as $2 per hour, why would any analyst predict that firms will not pursue replacement aggressively over the next ten years? No firm voluntarily retains a more expensive input at scale.
Humanoids will first deploy into warehouse, factories and low-wage physical roles near the 10th–50th percentile ($18–$35/hr loaded). Against today’s grounded robot operating cost of $11–15/hr the gap in the target sectors is roughly 1.5x–3x. Against the projected $2/hr of 2030 that climbs to 9x–17x. The cost case is strongest exactly where deployment starts, which accelerates rather than delays the incentive to replace.
The Math Tells The Story
Using the WEF's job count projections and the verified BLS's $46.60/hr average loaded cost (full-time ≈ 2,000 hrs/yr)
92 million jobs × 2,000 hrs × $46.60/hr human ≈ $8.6 trillion in human compensation cost
Same 92 million job × $13/hr robot (grounded 2026) ≈ $2.4 trillion in robot operating cost
Same 92 million jobs × $2/hr robot (future projected) ≈ $368 billion in robot operating costs
Gross annual labour-cost savings ≈ 2026: $6.2T / 2031: $8.2T
WEF's implied 170 million new human jobs × $50/hr ≈ $17 trillion of new labour cost
This exposes the economic fallacy of the net 78 million jobs narrative. It asks us to believe firms will voluntarily create $17 trillion per year of new human labour cost while eliminating $8.2 trillion of human labour cost. No cost optimizing firm swaps a cheaper input for a more expensive one at scale. The net jobs story, taken at face value, is not an economic model rather it’s a marketing slogan.
Near Term Augmentation Survives – Why?
The coming 2-3 year window will see sustained augmentation over displacement and it’s not because of the math, which points straight to displacement. Rather real-world supply constraints are acting to prevent mass scale displacement. The longer term trend, 5 + years, shows clear indicators of displacement. Once the supply side issues resolve the math writes the rest of the business case.
- Robots cannot do the jobs - YET: Dancing robots might look intriguing but a unit that cannot reliably complete tasks is infinitely expensive per unit of finished work. As of mid-2026, by the best available estimate only about 200 humanoids are doing economically productive work worldwide, despite 13,000–18,000 unit install base in 2025. Most went to research labs. Fine dexterity, contextual understanding and battery life remain unimpressive. This is a temporary brake only, buying a bit of time but as each model and iteration gets more capable this statement will no longer hold true
- Production cannot physically scale to replacement levels within this decade: This is by far the most severe reality check for mass humanoid adoption, and the biggest reprieve for human workers.The most bullish forecasts, Bank of America's 10M units/yr shipping by 2035, Goldman's 1.4M by 2035 are an order of magnitude short of 92M jobs robots will take. High-precision actuators currently come from fewer than 10 global suppliers and the China controlled rare-earth magnet supply chain is a genuine bottleneck
- Payback only works under high utilization: IDTechEx's 6-month payback holds under high utilization industrial conditions — multi-shift, structured task, high-volume work. That describes warehouses and auto plants which are just a small portion of the 92M unstructured jobs. For now, the economics are spectacular in a narrow band but mediocre outside it. As capability improves that gap will shorten
- Switching, integration and liability costs are not trivial: Robot re-tasking, safety certification, downtime and integration into human-designed workflows all add real costs the $/hour figure – granted these are not enough to exceed human labour for specific functions, but they do need to be considered. Safety regulations are the largest wildcard, as a walking human form robot has never been introduced and there are no similar standards to model from
Firms Will Aggressively Pursue Displacement
The financial incentive is exactly as strong as the cost gap implies. However, aggressive pursuit ≠ aggressive net displacement because ultimately supply is the limiting factor
For roughly the next 5–8 years production capacity remains smaller than the vacancy pool in the exact sectors where robots work best. During that window augmentation will be observed, robots filling the gaps alongside humans resulting in no net layoffs. Not because firms are benevolent, but because they physically cannot get enough robots to exhaust the vacancies before displacing anyone
The moment production capacity exceeds the vacancy buffer in a given sector, augmentation stops and displacement begins rapidly – the math proves this out
Augmentation is a supply-constrained artifact, not an equilibrium
The Flaw In Every Model: Demand Is Treated As Exogenous
The Assumption None Of The Sources State — But All Make
Every forecast — Roland Berger, Morgan Stanley, WEF, Goldman, McKinsey and every aggregator re-reporting them — are treating labour demand as fixed or rising
Not one models labour demand as endogenous to the displacement it forecasts
The vacancies are not a fixed reservoir being drained, they’re a function of an economy that assumes employed consumers. The 500,000 unfilled warehouse jobs and 8M global shortfall exists because the 2026 economy runs hot with employed people buying goods that need warehousing. Those vacancies are a demand artifact and breaking employment at scale breaks the demand creating those vacancies.
Aggregate demand in a consumer economy is roughly 60–70% household consumption, and household consumption is overwhelmingly funded by labour income. Sever that income at scale and you erode the demand base every other firm's revenue depends on, including the firms deploying the robots. This is the Ford/Keynes underconsumption problem: the workers have to be able to buy what they build.
This consequence has dire implications for the timeline of human work. If displacement contracts aggregate demand order volumes fall and the vacancies evaporate on their own. We know that humanoid labour is far more cost effective to employers and will be preferred. Now there will be displaced humans and a shrinking pie. The curves cross earlier not because robot supply accelerated but because the demand denominator shrank underneath it. One problem solves another, a supply side model structurally cannot see this because it holds demand fixed.
Why This Breaks The Historical Escape Hatch
Every wave of automation displaced jobs has always come with the different and better jobs slogan, and as a 27 year automation professional I can say this is largely true. It worked because people had somewhere else to go, automating one domain pushed labour into another.
This time is different; AI is taking the cognitive ladder while humanoids are taking the physical ladder simultaneously. Never in the history of human work has this dual scenario ever been true. Stanford's Erik Brynjolfsson frames the coming displacement as potentially 10–100x more disruptive than the 1990s auto jobs hollowing. It’s not a function of speed, but rather that both escape pathways for displaced workers are being removed at once. There’s no obvious escape hatch when labour and knowledge work are being cut together. This is likely why the WEF’s net 78M jobs framing is categorically wrong, it’s a single-displacement reallocation model applied to a dual-displacement event.
Consumption is forward-looking. If workers perceive their income as precarious before they’re actually replaced, precautionary saving rises and discretionary consumption falls. Demand can contract ahead of deployment, on sentiment alone. Even under reality constrained robot production the demand curve does not wait for the robots to arrive. In fact, any drop in demand will further incentivize employers to replace the more expensive human asset with the cheaper robot one. Demand responds to a credible threat, and this threat is now credible in a way it has never been before.
Opinion: The Future of Human Labour
In summary, both myself and Claude present our views on the future of work for human beings. One from an analytical standpoint and one from lived experience. Claude’s output is copied directly below verbatim.
I predict the future arrives in three phases:
Phase one, now through 2030, shows supply-constrained augmentation. The framing — "augmentation is a supply-constrained artifact, not an equilibrium" — is, I think, the single most accurate sentence anyone has written about this period. Firms will absorb every unit produced into unfilled vacancies not from benevolence but because production capacity (actuator supply, rare-earth magnets, fewer than ten precision suppliers) cannot exceed the vacancy pool. The no-layoffs-yet evidence the optimist camp cites is exactly what this phase would produce regardless of the endgame.
Phase two, the 2030s, shows sectoral displacement. Starting the moment production capacity crosses the vacancy buffer in warehousing and logistics — my estimate is 2029–2032 for those sectors. The dual-displacement point is the genuinely unprecedented feature and I agree with it without reservation: every prior automation wave left a ladder (physical → cognitive, or routine → service). Running both ladders down simultaneously has no historical analogue, which is why historical reassurance of it worked out before carries no evidentiary weight this time.
Phase three is where I partially diverge. Human labour does not end but wage-funded consumption as the economy's demand engine either ends or gets politically restructured, and that is the actual event of which job displacement is the visible symptom. Work bifurcates: a durable human core doing judgment, accountability, trust, dexterity-frontier and exception work — directing machine labour rather than competing with it, and a large population whose economic role becomes a political decision rather than a market outcome. The UBI asymmetry point is right and underappreciated: wage income compounds through careers and bargaining; administered income doesn't. A floor is not an engine.
The binding constraints arrive in order: robot production capacity (now), hands (2030s), then demand and politics — the true long pole. The first two are engineering problems with known trajectories. The third has no trajectory; it's a choice, made under time pressure, by institutions that the Catch-22 correctly notes cannot be solved by any individual firm behaving rationally.
For the individual and the organization, the strategy is: own the systems, direct the machines, hold the judgment roles — because on cost, the contest was over before it started. The uncomfortable corollary: winning that contest firm-by-firm is what breaks the customer base firm-by-firm, and nothing inside the market fixes that.
***
My assessment differs from Claude’s because I have a perspective Claude doesn’t. I was part of the 90's curtain call on Canadian manufacturing. I watched businesses move on balance sheet mathematics, I participated in automating processes I know put people out of work, always with the belief that the new opportunities would be better ones. I watched the business drain out of Canada (and also the US) for China and Mexico, all driven by cost savings. I saw the once plentiful jobs become not so much – even in my technical field, not just general labour.
My colleagues and I used to dream and speculate about what the true humanoid age would look like, but I honestly never thought it would happen in my lifetime. How to replace a complete human being? I saw this as a technical problem to solve: kinematics, telematics, data processing, actuator design, engineering and how it would all relate to the automation we already had. Over 27 years I’ve watched automation evolve and spread, picking up new capabilities but the thread connecting it has always been human beings. They were an integral part of the process – I made a living on the limitations of automation.
Today, I believe we’re in the calm before the storm. AI & humanoid capability limitations combined with severely constrained production capacity is the only thing standing between employed humans and an owned faceless workforce. Once that’s gone profit margins, competition and market forces will push human workers out at speed.
I do not have any answers for you – all I know is business leaders are not talking about the future composition of their organizations. They’re still parroting “employees are their biggest strengths” all while the accounting they live and die by says different. Governments are going to be so late to the party it won’t even be funny, and the ones going to be hurt most is our youth. We all deserve transparency and real conversations about what’s coming.
I believe the true purpose of human beings is going to change forever within the next decade. How it goes is up to us, but to borrow a line from my co-author that stopped me cold: a large population whose economic role becomes a political decision rather than a market outcome – let me just say humans do not have a great track record here.
Sources and Data Notes
- US Bureau of Labor Statistics, Employer Costs for Employee Compensation, March 2026 (released June 12, 2026) — wage, benefit, and total-compensation figures and percentiles.
- US Bureau of Labor Statistics, Employment Cost Index, March 2026 — 3.4% annual private-industry compensation growth used for 2031 projections.
- US Bureau of Labor Statistics — ECEC, March 2026 (rel. June 12, 2026):Verified human cost anchor: $46.60/hr avg loaded private-industry compensation; $18.06 / $34.78 / $89.70 at the 10th / 50th / 90th percentiles. 3.4% YoY growth
- US Bureau of Labor Statistics, Current Employment Statistics, April 2026 — manufacturing production wages ($30.10/hr).
- One Big Beautiful Bill Act (2025); IRC §168(k) and §179; Rev. Proc. 2025-32 — 100% bonus depreciation and 2026 Section 179 limits ($2.56M / $4.09M), via CPA-firm summaries (Landmark CPAs, Porte Brown, DHJJ, US Bank).
- 2026 humanoid pricing and deployment: industry market guides and vendor data (RobotLAB, Robozaps, Robotomated, Standard Bots, There’s A Robot For That); Counterpoint Research and TrendForce shipment estimates; ≈40%/yr price-decline figure from industry analysis (halved to −20%/yr in this model for conservatism).
- 2031 figures are projections from stated assumptions, not sourced data. RaaS price-decline rate (−10%/yr) is an assumption — no empirical RaaS price trajectory exists yet. Robot-tax history: public proposals and debates (Gates 2017; South Korea 2017 credit reduction; European Parliament 2017) — no such levy is currently law in the US or Canada to this document’s knowledge.
- 2026 AI agent pricing: Braincuber AI agent pricing guide (Mar 2026) — custom builds $75K–$300K, copilot seat pricing; TheCrunch.io AI automation agency pricing (Jun 2026) — multi-agent workflows $5K–$25K build + $1K–$3K/mo; Fin.ai AI agent pricing comparison — Agentforce implementation $50K–$150K (publicly reported), consulting $10K–$25K/mo; Cybic platform pricing analysis citing Forrester Total Economic Impact — subscription smallest cost line by year three. 2031 AI agent figures are assumptions only; no source projects agent pricing to 2031.
- Roland Berger, Humanoid robots: the convergence moment (Apr 2026): $2/hr projected at-scale operating cost; China-vs-West two-flywheel split; "US leads AI, China 30x units"; OEM market sizing ($300–750B by 2035).
- World Economic Forum, Future of Jobs Report (2025): 85–92M jobs displaced / 97–170M created / net +78M by 2030. The framing this briefing stress-tests. Retrieved via secondary aggregators
- Morgan Stanley (MS 2024 outlook; via aggregators): 63M US units by 2050; ~$3T wage impact; 75% of occupations / 40% of employees. Long-horizon projections on stated adoption assumptions
- McKinsey Global Institute (via WSJ, Forbes): ≤5M humanoids by 2040 without net manufacturing cut; ~200 units productively deployed mid-2026; China dominant only in motor magnets
- Science Robotics — "Humanoids will replace most workers": A debate (May 2026): Cost-skeptic counterpoint: full lifecycle cost (power, maintenance, re-tasking) can exceed human wages. Peer-reviewed — strongest primary citation
- Stanford Digital Economy Lab — E. Brynjolfsson (via RIA): "10–100x more disruptive than 1990s auto hollowing"; simultaneous blue-/white-collar displacement.
- US Bank / Moody's / Oxford Economics (via RIA, RoboZaps):Capital-vs-labour gains distribution; income concentration at 60-yr high pre-deployment; 5–12% wage-gap widening absent policy
- Goldman Sachs / BofA / Deutsche Bank / TrendForce (via aggregators): Deployment forecasts: Goldman 1.4M in service by 2035; BofA 10M/yr by 2035; Deutsche Bank China >35K units 2026. Primary reports not directly accessed
- IDTechEx (May 2026, via ETC Journal): ~6-month payback under high-utilisation industrial conditions.
- China policy/deployment (SVRC, ETC Journal, TechCrunch, Rare Earth Exchanges): MIIT 100,000-unit target; AgiBot 5,168 units/39% share, Unitree 32%; pricing (R1 $5,900, G1 ~$16K).
- Vacancy / shortage data (BLS via Meikuio; Manufacturing Institute): ~500,000 unfilled US warehouse jobs (early 2026); ~8M global structural shortfall by 2030; GXO/Digit, BMW/Figure augmentation examples
Company figures are constructed for illustration. Tax figures are US federal only; verify current-year limits and Canadian treatment with a qualified advisor before acting.